


Participation Fee Numbers Hold Steady
June 27, 2012
Although the use of participation fees to help fund interscholastic athletics in Michigan high schools has doubled during the last nine years, the percentage of schools assessing them has held steady over the last two, according to surveys taken by the Michigan High School Athletic Association of its member institutions.
The most recently completed survey indicates that of 514 member schools participating, 260 schools – 50.5 percent – charged participation fees during the 2011-12 school year. In the 2010-11 survey, fees were being used at 50.4 percent of schools participating.
There were 763 senior high schools in the MHSAA membership this school year – the survey generated a response rate of 68 percent. This was the ninth survey of schools since the 2003-04, when members reported that fees were being used in 24 percent of schools.
The most recent survey also showed that fees incurred by students who paid once for an entire year of participation increased slightly from 2010-11 to 2011-12 – although the maximum fee per family decreased slightly.
The most popular method of assessing participation fees continues to be a payment for each sport an athlete goes out for, used by 41.5 percent of schools in 2011-12. That median fee among schools in the survey has increased only $5, to $75, since 2009-10.
A standardized annual fee per student was used by 24.5 percent of schools in the past year. Since Fall 2003, that fee has increased from $75 to $120 – a 60 percent increase – with the fee increasing $20 per athlete from 2010-11 to 2011-12.
Beginning with the 2004-05 survey, schools were asked in the survey if they had a cap on what individual student-athletes and families could be charged. Caps on student fees have been used by the majority of schools, but that number has dropped from 71.3 percent in 2004-05 to 55 percent in 2011-12. However, the number of schools instituting a cap on what a family pays has increased from 41 percent having a limit in 2004-05 to 49 percent in 2011-12.
Other data from the 2011-12 survey shows 64.5 percent of schools with participation fees have some kind of fee reduction or waiver program in place based on existing programs for subsidized lunch and milk (down from 68 percent in 2010-11); that 14 percent of schools using fees report a drop in participation; and that slightly more than one percent of schools report losing students to other school districts because they are charging fees. Five percent of schools not assessing fees in 2011-12 report transfers to their districts because of the absence of fees. Also, seven percent of schools not assessing fees had done so previously.
The survey for 2011-12 and surveys from previous years can be found on the MHSAA Website by clicking on Schools – Administrators – Pay-To-Play Resources.
Records Set Despite Overall Participation Dip
July 9, 2014
By Geoff Kimmerly
Second Half editor
Participation in high school sports in which postseason tournaments are sponsored by the Michigan High School Athletic Association decreased slightly for the third straight school year in 2013-14, following a continuing trend of declining member school enrollments.
However, nine MHSAA sports saw increases in participation from 2012-13, and four sports set records for the second straight school year.
A total of 288,230 participants took part in the 28 tournament sports offered by the MHSAA during the past year – a 1.9-percent decrease from the 2012-13 figure of 293,810. However, enrollments at member schools also decreased 0.7 percent from 2012-13 and have fallen 10 percent since the 2006-07 school year – while MHSAA participation has fallen only 7.9 percent during that time. This year’s dip was slightly larger than the 1.2-percent decrease from 2011-12 to 2012-13.
Overall boys participation fell 1.7 percent from 2012-13 to 2013-14, while girls participation fell 2.2 percent. The overall MHSAA totals count students once for each sport in which they participate, meaning students who are multiple-sport athletes are counted more than once.
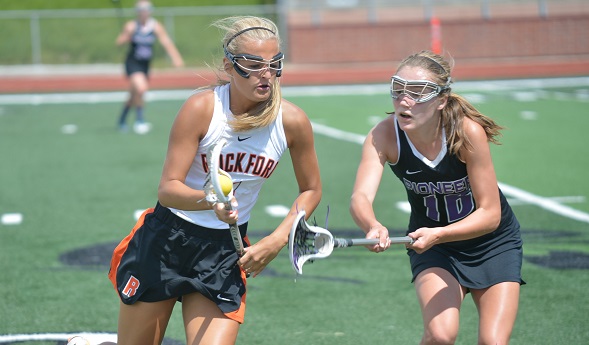
For the second straight school year, both boys and girls lacrosse (5,089 and 2,540, respectively) and boys and girls cross country (8,882 and 8,703) set participation records. Both lacrosse totals have increased annually during their 10 years as MHSAA tournament sports; the girls saw an increase of 1.6 percent from 2012-13. Participation in both boys and girls cross country increased for the fifth straight seasons – the girls this time by 3.9 percent.
Three girls sports rebounded from recent declines. Girls swimming and diving (6,604) broke a two-year downturn in participation with its highest total since 2010-11, while girls golf (3,427) increased by 2.8 percent and girls soccer (13,619) increased one percent after also falling from 2011-12 to 2012-13. Girls track and field (17,259) posted its second straight increase and highest participation total since 2009-10.
However, troubling trends continued in two of the most popular girls sports. Girls basketball participation fell for the eighth straight season to 16,329 participants, the sport’s fewest since records first were kept in 1991-92. The girls basketball total has decreased 14.7 percent since a U.S. District Court decision led to the switching of girls basketball season from fall to winter beginning in 2007-08. Comparatively, girls enrollment at MHSAA schools during that time has fallen 10.4 percent.
The sport that swapped seasons with girls basketball and moved to fall, volleyball, saw a 6.5-percent drop in participation this school year to 18,607 athletes, its fewest since 1993-94 and a decrease of 13.6 percent since its final season as a winter sport.
Also of note in this year’s survey:
- Total, nine sports saw increases in participation in 2013-14 (three boys, six girls), while 19 had decreases (11 boys, eight girls).
- Football participation, 11 and 8-player teams combined, dropped for the sixth straight season but this time by only 2 percent to 40,673 athletes. The drop from 2011-12 to 2012-13 was 3.7 percent.
- Wrestling saw a decrease for the fifth straight year, but also by a smaller percentage than the year before – 2.2 percent versus a 4.8-percent drop from 2011-12 to 2012-13.
- Baseball participation increased for the second straight year, up 0.7 percent to 18,227 participants. But softball saw the third-largest dip in 2013-14, 7.2 percent to 13,443 participants.
- Gymnastics (600) saw a decrease for the second straight year, this time by 11 percent – the largest percentage decrease of any sport this school year. Boys skiing (745) saw the second-largest drop, 9.7 percent.
The participation figures are gathered annually from MHSAA member schools to submit to the National Federation of State High School Associations for compiling of its national participation survey. Results of Michigan surveys from the 2000-01 school year to present may be viewed on the MHSAA Website.
The following chart shows participation figures for the 2013-14 school year from MHSAA member schools for sports in which the Association sponsors a postseason tournament:
BOYS GIRLS
SPORT |
SCHOOLS (A) |
PARTICIPANTS |
SCHOOLS (A) |
PARTICIPANTS (B) |
|
Baseball |
630/646/2 |
18,220 |
- |
-/7 |
|
Basketball |
727/732/2 |
21,504 |
676/723 |
16,321/8 |
|
Bowling |
341/359/1 |
3,573 |
326/357 |
2,939/7 |
|
Competitive Cheer |
- |
- |
311/337 |
7,120 |
|
Cross Country |
591/626/0 |
8,882 |
577/622 |
8,703/0 |
|
Football – 11 player |
596/660/3 |
39,963 |
- |
-/43 |
|
8-player |
36/39/0 |
667 |
- |
- |
|
Golf |
515/542/12 |
6,768 |
317/327 |
3,365/62 |
|
Gymnastics |
- |
- |
56/74 |
600 |
|
Ice Hockey |
219/268/2 |
3,564 |
- |
-/19 |
|
Lacrosse |
125/130/0 |
5,089 |
86/88 |
2,540/0 |
|
Skiing |
81/104/0 |
745 |
78/104 |
662/0 |
|
Soccer |
475/496/12 |
14,242 |
466/478 |
13,619/48 |
|
Softball |
- |
- |
569 |
13,443 |
|
Swimming & Diving |
242/266/1 |
5,243 |
260/274 |
6,064/8 |
|
Tennis |
312/318/2 |
6,464 |
338/347 |
8,856/6 |
|
Track & Field |
648/679/0 |
22,716 |
634/673 |
17,259/0 |
|
Volleyball |
- |
- |
662 |
18,607 |
|
Wrestling |