

Records Set Despite Overall Participation Dip
July 9, 2014
By Geoff Kimmerly
Second Half editor
Participation in high school sports in which postseason tournaments are sponsored by the Michigan High School Athletic Association decreased slightly for the third straight school year in 2013-14, following a continuing trend of declining member school enrollments.
However, nine MHSAA sports saw increases in participation from 2012-13, and four sports set records for the second straight school year.
A total of 288,230 participants took part in the 28 tournament sports offered by the MHSAA during the past year – a 1.9-percent decrease from the 2012-13 figure of 293,810. However, enrollments at member schools also decreased 0.7 percent from 2012-13 and have fallen 10 percent since the 2006-07 school year – while MHSAA participation has fallen only 7.9 percent during that time. This year’s dip was slightly larger than the 1.2-percent decrease from 2011-12 to 2012-13.
Overall boys participation fell 1.7 percent from 2012-13 to 2013-14, while girls participation fell 2.2 percent. The overall MHSAA totals count students once for each sport in which they participate, meaning students who are multiple-sport athletes are counted more than once.
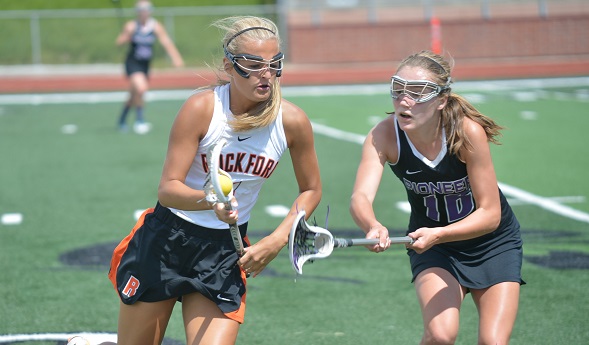
For the second straight school year, both boys and girls lacrosse (5,089 and 2,540, respectively) and boys and girls cross country (8,882 and 8,703) set participation records. Both lacrosse totals have increased annually during their 10 years as MHSAA tournament sports; the girls saw an increase of 1.6 percent from 2012-13. Participation in both boys and girls cross country increased for the fifth straight seasons – the girls this time by 3.9 percent.
Three girls sports rebounded from recent declines. Girls swimming and diving (6,604) broke a two-year downturn in participation with its highest total since 2010-11, while girls golf (3,427) increased by 2.8 percent and girls soccer (13,619) increased one percent after also falling from 2011-12 to 2012-13. Girls track and field (17,259) posted its second straight increase and highest participation total since 2009-10.
However, troubling trends continued in two of the most popular girls sports. Girls basketball participation fell for the eighth straight season to 16,329 participants, the sport’s fewest since records first were kept in 1991-92. The girls basketball total has decreased 14.7 percent since a U.S. District Court decision led to the switching of girls basketball season from fall to winter beginning in 2007-08. Comparatively, girls enrollment at MHSAA schools during that time has fallen 10.4 percent.
The sport that swapped seasons with girls basketball and moved to fall, volleyball, saw a 6.5-percent drop in participation this school year to 18,607 athletes, its fewest since 1993-94 and a decrease of 13.6 percent since its final season as a winter sport.
Also of note in this year’s survey:
- Total, nine sports saw increases in participation in 2013-14 (three boys, six girls), while 19 had decreases (11 boys, eight girls).
- Football participation, 11 and 8-player teams combined, dropped for the sixth straight season but this time by only 2 percent to 40,673 athletes. The drop from 2011-12 to 2012-13 was 3.7 percent.
- Wrestling saw a decrease for the fifth straight year, but also by a smaller percentage than the year before – 2.2 percent versus a 4.8-percent drop from 2011-12 to 2012-13.
- Baseball participation increased for the second straight year, up 0.7 percent to 18,227 participants. But softball saw the third-largest dip in 2013-14, 7.2 percent to 13,443 participants.
- Gymnastics (600) saw a decrease for the second straight year, this time by 11 percent – the largest percentage decrease of any sport this school year. Boys skiing (745) saw the second-largest drop, 9.7 percent.
The participation figures are gathered annually from MHSAA member schools to submit to the National Federation of State High School Associations for compiling of its national participation survey. Results of Michigan surveys from the 2000-01 school year to present may be viewed on the MHSAA Website.
The following chart shows participation figures for the 2013-14 school year from MHSAA member schools for sports in which the Association sponsors a postseason tournament:
BOYS GIRLS
SPORT |
SCHOOLS (A) |
PARTICIPANTS |
SCHOOLS (A) |
PARTICIPANTS (B) |
|
Baseball |
630/646/2 |
18,220 |
- |
-/7 |
|
Basketball |
727/732/2 |
21,504 |
676/723 |
16,321/8 |
|
Bowling |
341/359/1 |
3,573 |
326/357 |
2,939/7 |
|
Competitive Cheer |
- |
- |
311/337 |
7,120 |
|
Cross Country |
591/626/0 |
8,882 |
577/622 |
8,703/0 |
|
Football – 11 player |
596/660/3 |
39,963 |
- |
-/43 |
|
8-player |
36/39/0 |
667 |
- |
- |
|
Golf |
515/542/12 |
6,768 |
317/327 |
3,365/62 |
|
Gymnastics |
- |
- |
56/74 |
600 |
|
Ice Hockey |
219/268/2 |
3,564 |
- |
-/19 |
|
Lacrosse |
125/130/0 |
5,089 |
86/88 |
2,540/0 |
|
Skiing |
81/104/0 |
745 |
78/104 |
662/0 |
|
Soccer |
475/496/12 |
14,242 |
466/478 |
13,619/48 |
|
Softball |
- |
- |
569 |
13,443 |
|
Swimming & Diving |
242/266/1 |
5,243 |
260/274 |
6,064/8 |
|
Tennis |
312/318/2 |
6,464 |
338/347 |
8,856/6 |
|
Track & Field |
648/679/0 |
22,716 |
634/673 |
17,259/0 |
|
Volleyball |
- |
- |
662 |
18,607 |
|
Wrestling |

Applications Available on MHSAA Website for 2023-24 Scholar-Athlete Awards
By
Geoff Kimmerly
MHSAA.com senior editor
October 25, 2023
One of the Michigan High School Athletic Association’s most popular programs, the Scholar-Athlete Award, will again with Farm Bureau Insurance present 32 $2,000 scholarships to top student-athletes at member high schools during the 2023-24 school year.
 The MHSAA/Farm Bureau Insurance Scholar-Athlete Award highlights the value extracurricular activities play in the total education of high school students, often improving their academic achievements in the process. The Scholar-Athlete Award is in its 35th year. Since the award’s inception in 1988-89, Farm Bureau Insurance has presented $1,024,000 in scholarships through this program.
The first 30 scholarships will be presented on a graduated basis across the MHSAA’s traditional class structure. From Class A schools, six boys and six girls will receive scholarships; from Class B schools, four boys and four girls; from Class C schools, three boys and three girls; and from Class D schools, two boys and two girls will be honored. The final two scholarships will be awarded at-large to minority recipients, regardless of school size. The scholarships may be used at the institution of higher learning the recipients attend during the first year at those colleges.
Applications from individual schools will be limited to the number of available scholarships in their enrollment class. Class A schools may submit the names of six boys and six girls, Class B schools may submit four boys and four girls, Class C may submit three boys and three girls and Class D may submit two boys and two girls.
Students applying for Scholar-Athlete Awards must be graduating during the 2023-24 school year, carrying an unrounded 3.5 (on a 4.0 scale) grade-point average and have won a varsity letter in a sport in which the MHSAA sponsors a postseason tournament: baseball, girls and boys basketball, girls and boys bowling, girls competitive cheer, girls and boys cross country, football, girls and boys golf, girls gymnastics, ice hockey, girls and boys lacrosse, girls and boys skiing, girls and boys soccer, softball, girls and boys swimming & diving, girls and boys tennis, girls and boys track & field, girls volleyball and wrestling.
Applicants will be required to show involvement in other school and community activities and submit an essay on the importance of sportsmanship in educational athletics.
Information – including answers to a number of frequently asked questions – and links to the application are available online on the Scholar-Athlete Award page. Applications are available in digital format only and must be submitted online by 4 p.m. Dec. 1.
A committee composed of school administrators from across the state will select finalists and winners in late January, with the winners to be announced throughout February. All applicants, finalists and scholarship recipients will be announced on the MHSAA Website. The 32 scholarship recipients will be recognized during the 2024 MHSAA Boys Basketball Finals at the Breslin Student Events Center in East Lansing.
Farm Bureau Insurance of Michigan was founded in 1949 by Michigan farmers who wanted an insurance company that worked as hard as they did. Those values still guide the company today and are a big reason why it is known as Michigan’s Insurance Company, dedicated to protecting the farms, families, and businesses of this great state. Farm Bureau Insurance agents across Michigan provide a full range of insurance services—life, home, auto, farm, business, retirement, Lake Estate®, and more— protecting more than 660,000 Michigan residents.
The MHSAA is a private, not-for-profit corporation of voluntary membership by more than 1,500 public and private senior high schools and junior high/middle schools which exists to develop common rules for athletic eligibility and competition. No government funds or tax dollars support the MHSAA, which was the first such association nationally to not accept membership dues or tournament entry fees from schools. Member schools which enforce these rules are permitted to participate in MHSAA tournaments, which attract more than 1.3 million spectators each year.