


Pay-to-Play Down Slightly, Survey Shows
July 24, 2018
By Geoff Kimmerly
Second Half editor
Slightly less than 50 percent of MHSAA member high schools assessed sports participation fees during the 2017-18 school year, according to an annual survey that enjoyed its highest response rate in 14 years of measuring the prevalence of charging students to help fund interscholastic athletics.
This year’s survey was completed by a record 80 percent of the MHSAA’s 751 member high schools, and 49 percent of respondents charged participation fees – down slightly from 49.7 percent in 2016-17, when the rate dropped below 50 percent for the first time since 2009-10.
The MHSAA conducted its first participation fee survey during the 2003-04 school year, when 24 percent of responding schools reported they charged fees. The percentage of member schools charging fees crossed 50 percent in 2010-11 and reached a high of 56.6 percent in 2013-14.
Class A schools remained the largest group charging fees in 2017-18, with 65 percent of respondents doing so – although that percentage was the lowest for Class A since 66 percent reported using fees in 2011-12. Class B schools fell to 47 percent charging fees (from 52 percent in 2016-17), while Class C (46 percent) and Class D (37) schools remained below 50 percent as well.
Charging a standardized fee for each team on which a student-athlete participates – regardless of the number of teams – remains the most popular method among schools assessing fees, with that rate at 43 percent of schools. Schools charging a one-time standardized fee per student-athlete showed a slight decrease to 28 percent, while assessing fees based on tiers of the number of sports a student-athlete plays (for example, charging a larger fee for the first team and less for additional sports) and assessing fees based on the specific sport being played (some being more expensive than others) both showed slight upticks to 15 and 5 percent, respectively.
The amounts of most fees remained consistent during 2017-18: the median annual maximum fee per student at $150, the median annual maximum family fee at $300 and the median per-team fee at $75 – all for at least the fourth straight year. The median fee assessed by schools that charge student-athletes once per year held steady at $125 for the second straight school year.
Click for the survey for 2017-18, and surveys from previous years can be found here.
Jacques to Receive Forsythe Award for Local Leadership, Peninsula & Statewide Service
By
Geoff Kimmerly
MHSAA.com senior editor
February 1, 2024
Serving as athletic director at Michigan’s northernmost high school, Calumet’s Sean Jacques has impacted student-athletes not only in his community, but across the Upper Peninsula and all the way to the state’s southern borders as a member of the Michigan High School Athletic Association’s Representative Council. To recognize his far-reaching contributions across several leadership roles, Jacques has been selected as the 2024 honoree for the MHSAA’s Charles E. Forsythe Lifetime Achievement Award.
The annual award is in its 47th year and named after former MHSAA Executive Director Charles E. Forsythe, the Association's first full-time and longest-serving chief executive. Forsythe Award recipients are selected each year by the MHSAA Representative Council, based on an individual's outstanding contributions to the interscholastic athletics community at the local, regional and statewide levels. Jacques will be honored during the MHSAA Girls Basketball Finals on March 23 at Michigan State University’s Breslin Center.
A 1985 graduate of Calumet, Jacques taught for one year at Lansing Everett before returning to his alma mater in 1992, when he began teaching primarily technology and metal shop until becoming the athletic director and an assistant principal in 2008. He served in those administrative roles through the end of the 2021-22 school year and currently is an instructor for the Calumet-Laurium-Keweenaw school district’s Upper Peninsula Virtual Academy.
During his tenure as athletic director, Calumet added junior varsity hockey, junior varsity and varsity softball, and varsity baseball, bowling and gymnastics teams. He led facility upgrades including the addition of a turf football field, new locker rooms and an additional gymnasium, creating a home not only for Copper Kings athletes and coaches but for those from all over the northern UP as Calumet is a frequent host of MHSAA District and Regional events plus Coaching Advancement Program (CAP) sessions.
Also under his direction, Calumet became the first Upper Peninsula school to join the MHSAA School Broadcast Program, and he created the high school’s Athletic Hall of Fame in 2012. In 2016, Calumet became the only Upper Peninsula school to earn the prestigious Michigan Exemplary Athletic Program honor from the Michigan Interscholastic Athletic Administrators Association (MIAAA).
“When I became athletic director, my goal was number one, we were going to run a classy program. We were going to do it right. We weren’t going to be lazy about anything, not take the easy road. I wanted to do right for the kids, the school district and the community,” Jacques said. “We went after a lot of different things. It’s very cliché, but we really did try to put kids first. Every decision we made, we always tried to make decisions with that in mind – what’s best for the kids – and worked hard to be innovative and try to run a quality, classy program.”
His impact hardly has been contained to the Keweenaw Peninsula. He served as president of both the Keweenaw Area Athletic Directors group and Upper Peninsula Athletic Directors Association from 2014-22, in addition to serving as commissioner for the Western Peninsula Athletic Conference from 2012-22 and the Great Lakes Hockey Conference from 2009-22. He began his tenure on the Upper Peninsula Athletic Committee in 2014, when he also was first elected to the MHSAA Representative Council as the delegate for Class C and D schools in the Upper Peninsula. He is serving on the MHSAA’s Audit and Finance Committee currently, and will conclude his tenure on Council in December.
Jacques also served as an MIAAA regional representative for more than a decade and was named Regional Athletic Director of the Year by the MIAAA in 2013 and 2016. The Upper Peninsula Athletic Directors Association named him its Upper Peninsula Athletic Director of the Year in 2019.
Jacques also currently is among eight mentors to new athletic administrators across the state as part of the MHSAA’s first-year AD Connection Program. In this role, Jacques directly works with 16 recently-hired athletic directors as they navigate the job’s many and various responsibilities.
“Sean Jacques brings knowledge of so many aspects of school sports, not only the work done day-to-day as an athletic director but as an innovator who developed an athletic department recognized and respected across the state,” MHSAA Executive Director Mark Uyl said. “His community, the Upper Peninsula and Michigan as a whole continue to benefit from his dedication and leadership – and we’re fortunate he’s sharing that expertise with the next generation of athletic directors as part of our mentorship program.”
Jacques has contributed nearly as significantly on the field of play. He has been an MHSAA registered official for 35 years, in hockey for the entirety and adding track & field in 1994-95 and cross country in 2009-10. He officiated at the MHSAA Hockey Finals in 2016 and has served as a board member for the Copper Country Hockey Officials Association, including as its scheduler for 14 years. He has 40 years as a registered official with USA Hockey, serving as officiating supervisor for the Michigan Amateur Hockey Association (MAHA) for 20 years and as Michigan’s referee-in-chief from 2006-15, and he was a member of USA Hockey’s national instructor staff from 1997-2019. An accomplished college official as well, he worked in that capacity for more than 25 seasons, including 15 at the Division I level in the Western Collegiate Hockey Association (WCHA) and Central Collegiate Hockey Association (CCHA).
His time at Calumet has included stepping into many more roles to help provide student-athletes with the fullest possible experience. He served as public address announcer for football for 16 seasons and Calumet hockey for more than a decade. He also lent his voice to radio broadcasts for Calumet volleyball and coached freshman football at the school for two seasons.
Jacques has served on the boards for the Calumet Hockey Association, Calumet All-Sports Booster Club and Calumet High School Band Parents Club, the latter two as treasurer. He remains president of the Hall of Fame board.
“I’m a Calumet grad, and when you’re the athletic director at the school you’re from, I think it’s something a little bit different,” Jacques said. “You bleed the school colors and put that extra effort in because it’s home.”
Jacques played football as a student at Calumet and served as the hockey team’s student equipment manager as a senior. He earned a bachelor’s degree in industrial education in 1989 from Northern Michigan University, and then a master’s in educational administration from NMU in 2000. He received his certified master athletic administrator (CMAA) designation in 2020 from the National Interscholastic Athletic Administrators Association (NIAAA) – becoming the only Upper Peninsula athletic director to achieve that accomplishment.
Jacques also has served his community as a volunteer firefighter since 1991 and as assistant fire chief since 1998.
Past recipients
1978 - Brick Fowler, Port Huron; Paul Smarks, Warren
1979 - Earl Messner, Reed City; Howard Beatty, Saginaw
1980 - Max Carey, Freesoil
1981 - Steven Sluka, Grand Haven; Samuel Madden, Detroit
1982 - Ernest Buckholz, Mt. Clemens; T. Arthur Treloar, Petoskey
1983 - Leroy Dues, Detroit; Richard Maher, Sturgis
1984 - William Hart, Marquette; Donald Stamats, Caro
1985 - John Cotton, Farmington; Robert James, Warren
1986 - William Robinson, Detroit; Irving Soderland, Norway
1987 - Jack Streidl, Plainwell; Wayne Hellenga, Decatur
1988 - Jack Johnson, Dearborn; Alan Williams, North Adams
1989 - Walter Bazylewicz, Berkley; Dennis Kiley, Jackson
1990 - Webster Morrison, Pickford; Herbert Quade, Benton Harbor
1991 - Clifford Buckmaster, Petoskey; Donald Domke, Northville
1992 - William Maskill, Kalamazoo; Thomas G. McShannock, Muskegon
1993 - Roy A. Allen Jr., Detroit; John Duncan, Cedarville
1994 - Kermit Ambrose, Royal Oak
1995 - Bob Perry, Lowell
1996 - Charles H. Jones, Royal Oak
1997 - Michael A. Foster, Richland; Robert G. Grimes, Battle Creek
1998 - Lofton C. Greene, River Rouge; Joseph J. Todey, Essexville
1999 - Bernie Larson, Battle Creek
2000 - Blake Hagman, Kalamazoo; Jerry Cvengros, Escanaba
2001 - Norm Johnson, Bangor; George Lovich, Canton
2002 - John Fundukian, Novi
2003 - Ken Semelsberger, Port Huron
2004 - Marco Marcet, Frankenmuth
2005 - Jim Feldkamp, Troy
2006 - Dan McShannock, Midland; Dail Prucka, Monroe
2007 - Keith Eldred, Williamston; Tom Hickman, Spring Lake
2008 - Jamie Gent, Haslett; William Newkirk, Sanford Meridian
2009 - Paul Ellinger, Cheboygan
2010 - Rudy Godefroidt, Hemlock; Mike Boyd, Waterford
2011 - Eric C. Federico, Trenton
2012 - Bill Mick, Midland
2013 - Jim Gilmore, Tecumseh; Dave Hutton, Grandville
2014 - Dan Flynn, Escanaba
2015 - Hugh Matson, Saginaw
2016 - Gary Hice, Petoskey; Gina Mazzolini, Lansing
2017 - Chuck Nurek, Rochester Hills
2018 - Gary Ellis, Allegan
2019 - Jim Derocher, Negaunee; Fredrick J. Smith, Stevensville
2020 - Michael Garvey, Lawton
2021 - Leroy Hackley Jr., Byron Center; Patti Tibaldi, Traverse City
2022 - Bruce Horsch, Houghton
2023 - Karen Leinaar, Frankfort
The MHSAA is a private, not-for-profit corporation of voluntary membership by more than 1,500 public and private senior high schools and junior high/middle schools which exists to develop common rules for athletic eligibility and competition. No government funds or tax dollars support the MHSAA, which was the first such association nationally to not accept membership dues or tournament entry fees from schools. Member schools which enforce these rules are permitted to participate in MHSAA tournaments, which attract more than 1.4 million spectators each year.
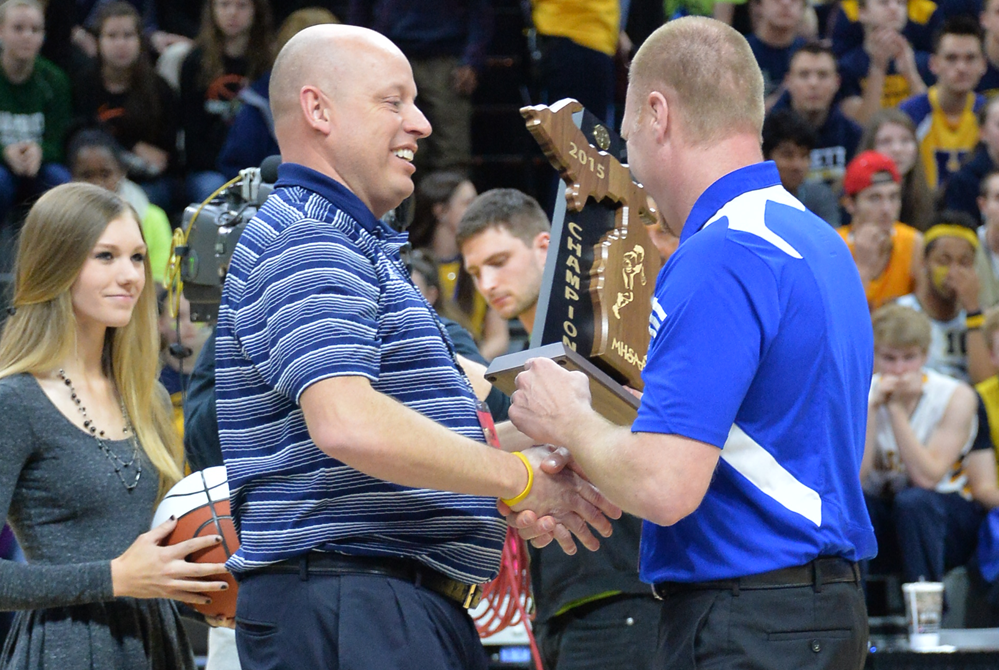
PHOTO Calumet athletic director Sean Jacques, second from left, presents the Class C girls basketball championship trophy to Copper Kings coach Jeff Twardzik in 2015.