

March Magic Hoopfest Returns to MSU
March 17, 2014
By Geoff Kimmerly
Special to Second Half
March Magic Hoopfest will return to Jenison Field House for this weekend’s Michigan High School Athletic Association Boys Basketball Finals, marking the fifth championship weekend the event has run concurrent with the games being played at Michigan State University’s Breslin Center.
A number of favorite attractions will return including slam dunk (on lowered rims), 3-point shootout and full-court rainbow shot areas where fans can come at any time and participate. Also returning is the Walk of History, showcasing championship games, life-size photos and display boards from throughout the MHSAA Finals’ near century-long run. A large video screen will play a series of “Buzzer Beaters,” “Battle of the Fans” and other MHSAA-produced videos.
Two Hoopfest center courts will host a number of games throughout the event, including the “JumpBall Jamboree” made up of teams of boys and girls in grades 5-8, a wheelchair basketball tournament and a series between four Special Olympics Project UNIFY high school teams.
Admission to the March Magic Hoopfest is $2 per person, and fans attending the MHSAA Boys Basketball Semifinals and Finals will be admitted free with their game tickets. Hours on March 20 and 21 will be 2 p.m. to 7 p.m.; the event is open from 10 a.m. to 7 p.m. on March 22. Jenison Field House, site of Hoopfest, also was the site of the MHSAA Boys Basketball Finals for 31 years. To find out more general information about the event, visit the March Magic Hoopfest Website.
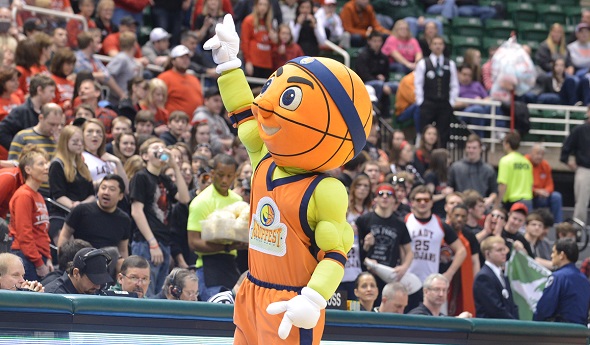
Hoopfest also will be home to Hoopie, the event’s mascot who made his first public appearances during the MHSAA Girls Basketball Finals. Click for video of Hoopfest’s newest volunteer as he helped prepare for this weekend’s event:
The March Magic Hoopfest is being conducted in a partnership between the Greater Lansing Sports Authority (GLSA), a division of the Greater Lansing Convention and Visitors Bureau; and the MHSAA, with vital support coming from the Department of Intercollegiate Athletics at Michigan State University.
“March Magic Hoopfest is a giant playground. There are opportunities for fun all over Jenison – and it’s a great way to spend an hour while waiting for the next round of games to start,” MHSAA Director of Brand Management Andy Frushour said. “All of us can remember reenacting games of our high school heroes. What better place to let kids do so now than across the street from Breslin Center in one of the most storied buildings in this state’s basketball history.”
The Greater Lansing Sports Authority’s mission is to be the leading voice of sports tourism in the Greater Lansing area and to promote economic growth by attracting a diverse range of sporting events to the region. The GLSA strives to enhance the quality of life for area residents through the development of local sports and fitness programs for all ages and supports the continued development and maintenance of safe, high-quality athletic facilities.
Hoopfest was not held at the 2013 Finals due to a Big Ten championship event being hosted by Jenison Field House.
"The GLSA is excited to partner with the MHSAA on the re-launch of March Magic Hoopfest," said Mike Price of the Greater Lansing Sports Authority. "While Hoopfest was absent in 2013, planning and improvement were ongoing. We are excited to showcase an improved Hoopfest that includes new games and activities, as well as the launch of our new mascot, Hoopie!”
PHOTO: Hoopie made his first public appearance during the weekend's MHSAA Girls Basketball Finals at the Breslin Center.
Participation Stays Above Enrollment Dip
July 13, 2017
By Geoff Kimmerly
Second Half editor
Enrollment in Michigan High School Athletic Association member high schools continued a trend of slight declines in 2016-17, but participation in sports held firm as records were set in three of the 28 sports for which postseason tournaments are sponsored by the MHSAA.
A total of 283,625 participants competed in MHSAA-sponsored sports this past school year, down 0.21 percent from 2015-16. However, this year’s decrease falls in line with a decrease in enrollment at member schools of 0.40 percent. The overall MHSAA participation totals count students once for each sport in which they participate, meaning students who are multiple-sport athletes are counted more than once.
Despite a drop in girls enrollment of 0.60 percent in 2016-17, girls participation increased for the second straight school year to 119,937 participants, an increase of 0.55 percent. Boys overall participation fell 0.76 percent to 163,688 participants, slightly sharper than the drop in boys enrollment of 0.21 percent for the school year. However, eight girls sports and eight boys sports saw increases in participation in 2016-17.
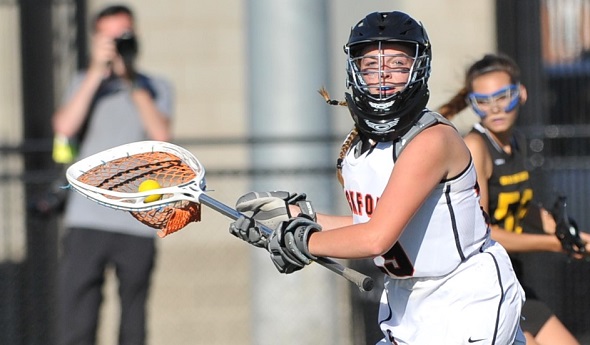
Boys and girls lacrosse continued their record-setting climb, boys lacrosse with 5,114 participants to increase 3.3 percent from 2015-16 and break its record set in 2013-14. Girls lacrosse saw 2,814 participants, an increase of 1.4 percent from the previous year, to continue its streak of setting a participation record every season since becoming a sponsored tournament sport in 2005. Boys cross country also set a record for the second straight season, this time with an increase of 1.7 percent to 9,415 participants total.
Good news also came from girls basketball, which ended a string of 10 straight declines in participation with an increase of 2.2 percent in 2016-17 – those 15,896 participants were the most in the sport since 2013-14. The largest percentage increases by far in 2016-17 were seen in boys and girls skiing, which were up 16.4 and 14.4 percent, respectively, with 837 boys participants and 746 girls after both experienced decreases in participation the school year before.
A number of other sports also saw increases on both the boys and girls’ sides: swimming & diving saw a 5.2 percent increase for boys and 4.1 increase for girls, track & field saw a 2.4 percent increase for girls and 1.9 percent increase for boys, girls cross country joined its boys counterpart with a 1.0 percent increase in participation, and tennis saw a 2.8 percent increase for girls and 0.48 increase for boys. That boys tennis increase ended a string of seven straight years of declining participation.
Other sports to see increases in 2016-17 were girls golf, increasing for the second straight season, this time 2.9 percent to 3,561 participants; boys ice hockey, up 1.8 percent to 3,411 participants; and boys soccer up 0.38 percent to 14,630 participants.
Also of note in this year’s survey:
• The increase in participation for 16 sports during 2016-17 was compared to an increase in 15 sports for 2015-16 and only eight sports in 2014-15.
• After a significant slowing in participation decline in football over the previous three years, 2016-17 saw a decline of 4.6 percent, or 1,805 participants from 2015-16. The number of school-sponsored football programs remained consistent over the last two years – there were 642 in 2015-16 and 640 in 2016-17 (up from 630 in 2014-15). But there was a shift of programs from 11-player to 8-player; there were 15 fewer 11-player programs in 2016-17 than the year before, but 13 more 8-player programs.
• Of the 12 MHSAA sports that saw participation declines in 2016-17, three were by mere hundredths of a percent. Boys wrestling saw a decline of three participants total, girls gymnastics had two fewer participants and boys golf participation decreased by one person.
The participation figures are gathered annually from MHSAA member schools to submit to the National Federation of State High School Associations for compiling of its national participation survey. Results of Michigan surveys from the 2000-01 school year to present may be viewed by clicking here.
The following chart shows participation figures for the 2016-17 school year from MHSAA member schools for sports in which the Association sponsors a postseason tournament:
|
BOYS |
GIRLS |
|||
SPORT |
SCHOOLS (A) |
PARTICIPANTS |
SCHOOLS (A) |
PARTICIPANTS (B) |
|
Baseball |
635/656/6 |
17,989 |
- |
0/9 |
|
Basketball |
722/735/1 |
21,263 |
690/725 |
15,896/4 |
|
Bowling |
363/381/10 |
3,792 |
341/369 |
2,926/24 |
|
Competitive Cheer |
- |
- |
334/349 |
6,720 |
|
Cross Country |
618/649/0 |
9,415 |
609/646 |
8,489 |
|
Football - 11 player |
580/592/87 |
36,460 |
- |
0/111 |
|
- 8-player |
60/61/11 |
1,130 |
- |
14 |
|
Golf |
496/526/59 |
6,170 |
329/342 |
3,561/100 |
|
Gymnastics |
- |
- |
72/88 |
636 |
|
Ice Hockey |
233/257/14 |
3,397 |
|
0/14 |
|
Lacrosse |
147/153/3 |
5,110 |
107/107 |
2,814/4 |
|
Skiing |
92/102/3 |
830 |
89/103 |
746/7 |
|
Soccer |
481/499/23 |
14,541 |
459/483 |
13,212/89 |
|
Softball |
- |
- |
616/646 |
13,641 |
|
Swimming & Diving |
243/274/12 |
4,919 |
256/283 |
5,600/60 |
|
Tennis |
293/309/9 |
6,085 |
327/341 |
8,920/21 |
|
Track & Field |
655/683/0 |
23,232 |
648/681 |
17,009/0 |
|
Volleyball |
- |
- |
704/720 |
19,067 |
|
Wrestling |
459/483/159 |
9,355 |
- |
0/2 |
(A) The first number is the number of schools reporting sponsorship on the Sports Participation Survey. The second number indicates schools sponsoring the sport including primary and secondary schools in cooperative programs as of May 22, 2017. The third number indicates the number of schools that had girls playing on teams consisting primarily of boys.
(B) The second number indicates the number of additional g