


Girls Events Set Record in 2013-14
September 18, 2014
By Geoff Kimmerly
Second Half editor
Michigan High School Athletic Association postseason tournaments drew more than 1.4 million fans in 2013-14 for the 15th straight school year, keyed in part by record attendance at girls events.
Total attendance for 2013-14 was 1,423,229 fans, with 988,669 at boys tournaments and 434,560 spectators at girls tournaments. Attendance is kept for all sports except golf, skiing and tennis, for which admission typically is not charged.
Total attendance did fall 10,127 fans, or 0.7 percent, from 2012-13. However, the girls tournament total broke a previous record set during the 2009-10 school year, with three girls sports setting overall attendance records: volleyball (101,654 fans), lacrosse (5,737) and competitive cheer (25,996). Boys and girls bowling tournaments, conducted simultaneously, also set an attendance record with 12,595 fans.
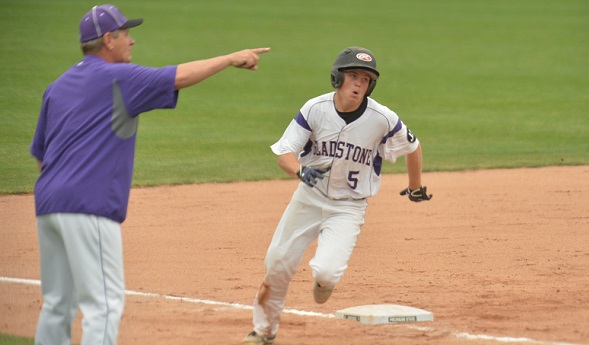
Cheer attendance increased for the 11th consecutive year and 2.8 percent from 2012-13; Cheer Finals attendance increased for the fifth straight year to a record 7,766 fans. The Boys Ice Hockey Finals also set a record with 14,595 fans, an increase of 1,690 over the previous year, while ice hockey’s total tournament attendance (60,778) was up 2.9 percent with increases at the Pre-Regional and Quarterfinal levels as well. Bowling, in addition to an overall attendance record, also saw a record for its Finals of 4,100 fans. The Baseball and Softball Finals, played at Michigan State University for the first time, did not set a record – but did draw 5,297 fans, a 29-percent increase from the previous season.
Attendance at boys tournament events fell to its lowest total since 1993-94, although the decrease from 2012-13 was less than one percent. However, football, despite a 1.5-percent decrease in attendance from the previous season, remained the highest MHSAA tournament draw for the seventh consecutive year with 392,069 fans. Football Finals attendance (52,409) rebounded 10.6 percent from 2012-13 after a similarly significant drop following 2011-12.
Boys Basketball Finals weekend attendance also bounced back significantly, with a 21.7-percent increase from the 2012-13 event to a three-day total of 42,373 fans at the Semifinals and Finals. Regional attendance also was up 4.8 percent, although overall boys basketball tournament attendance was down 3.2 percent to 308,205 fans. Girls basketball attendance was down 2.8 percent to 161,569 fans with Finals weekend attendance down 11.8 percent from 2012-13 – although the total Finals attendance of 16,763 fans in 2013-14 was the second-highest over the last four seasons, and attendance at Regionals and Quarterfinals increased from the previous girls basketball season.
Volleyball attendance increased 5.7 percent from 2012-13 while setting a District record of 68,447 fans, 16 percent more than the previous record set during 2011-12. Girls lacrosse bounced back from a slight drop in 2012-13 to set a record for overall attendance with 5,737 fans including a record for Semifinal attendance. Softball (3.7 percent to 42,242 fans), girls soccer (0.9 percent to 27,072) and girls swimming and diving (3.2 percent to 5,084) also saw attendance increases from 2012-13 – with girls soccer enjoying an 18-percent increase at the District level – while gymnastics (1,877) saw its lowest tournament attendance since 2007-08.
Five more sports saw attendance increases in 2013-14: Individual wrestling (49,037) was up 2.8 percent, boys lacrosse (7,726) was up 6.1 percent, baseball (47,540) was up 3.9 percent, boys and girls cross country (17,300) increased 1.9 percent and boys soccer (28,903) drew 35 more fans total than during 2012-13. Boys and girls cross country postseason events, like for bowling, are conducted simultaneously.
The MHSAA is a private, not-for-profit corporation of voluntary membership by more than 1,500 public and private senior high schools and junior high/middle schools which exists to develop common rules for athletic eligibility and competition. No government funds or tax dollars support the MHSAA, which was the first such association nationally to not accept membership dues or tournament entry fees from schools. Member schools which enforce these rules are permitted to participate in MHSAA tournaments, which attract more than 1.4 million spectators each year.
Despite Overall Dip, 8 Sports Add Athletes
July 8, 2015
By Geoff Kimmerly
Second Half editor
Eight high school sports for which postseason tournaments are sponsored by the Michigan High School Athletic Association enjoyed gains in participation during the 2014-15 school year. However, total participation in MHSAA sports decreased slightly for the fourth straight school year, following a continuing trend of declining member school enrollments.
A total of 282,623 participants took part in the 28 tournament sports offered by the MHSAA during the past year – a 1.95-percent decrease from the 2013-14 figure of 288,230. However, enrollments at member schools also decreased 1.24 percent from 2013-14 and have fallen 11.1 percent since the 2006-07 school year – while MHSAA participation has fallen only 9.7 percent during that time. This year’s dip was only slightly larger than the 1.9-percent decrease from 2012-13 to 2013-14.
Overall boys participation fell 1.5 percent from 2013-14 to 2014-15, while girls participation fell 2.6 percent. The overall MHSAA totals count students once for each sport in which they participate, meaning students who are multiple-sport athletes are counted more than once.
Girls lacrosse was the only MHSAA sport to set a participation record during 2014-15, with 2,589 athletes (an increase of 1.9 percent) this spring, and has set a participation record every season since becoming a sponsored tournament sport in 2005. However, boys lacrosse, which also became tournament sponsored in 2005, saw its first decrease in participation, falling 2.6 percent to 4,958 athletes despite five schools adding programs to bring that total to 130.
Baseball participation increased for the fourth straight school year, this season six tenths of a percent to 18,333 athletes. The other six sports that saw increased participation during 2014-15 all bounced back from decreases between 2012-13 and 2013-14. Boys bowling increased 4.2 percent to 3,724 athletes, its second-highest total as an MHSAA tournament sport. Both boys skiing (4.0 percent increase to 775 athletes) and girls skiing (1.4 percent to 671) also saw higher participation after two seasons of declines. Girls competitive cheer (1.0 percent to 7,189 athletes), girls gymnastics (3.0 percent to 618) and boys soccer (1.0 percent to 14,426) also saw bounce-back years after dips the school year before.
However, two of the most popular girls sports continued to experience downward trends. Girls basketball participation fell for the ninth straight season, to 15,702 athletes, the sport’s lowest total since records first were kept in 1991-92. The girls basketball total has decreased 18 percent since a U.S. District Court decision led to the switching of girls basketball season from fall to winter beginning in 2007-08. Comparatively, girls enrollment at MHSAA schools during that time has fallen 11.6 percent.
The sport that swapped seasons with girls basketball and moved to fall, volleyball, saw a 3.3-percent drop in participation this school year to 17,996 athletes, its fewest since 1991-92 and a decrease of 16.5 percent since its final season as a winter sport.
Also of note in this year’s survey:
- Total, eight sports saw increases in participation in 2014-15 (four boys, four girls), while 20 experienced decreases (10 boys, 10 girls).
- A recent drop in football participation, 11 and 8-player teams combined, has continued to slow, the total this season falling only 1.4 percent to 40,088 athletes. The drop from 2011-12 to 2012-13 was 3.7 percent, and the drop from 2012-13 to 2013-14 was two percent.
- Wrestling saw a decrease for the sixth straight year, this season to 9,475 participants, a 7.9-percent drop from 2013-14 with its lowest total since the collection of data began.
- Girls cross country, after five straight years of increases, fell back 4.1 percent, to 8,350 athletes, although that total still represented the third highest of the last seven seasons. The trend was identical for boys cross country, except this season’s total of 8,786 athletes was down only 1.1 percent from a year ago and the second-highest over the seven-season string.
- Swimming and diving saw the largest decrease among a pair of related sports; girls participation fell six percent to 4,938 athletes and boys fell 7.4 percent to 5,617 after both had experienced slight increases during the last three school years.
- Boys golf participation fell for the sixth straight season, to 6,533 athletes, its lowest since 1991-92.
The participation figures are gathered annually from MHSAA member schools to submit to the National Federation of State High School Associations for compiling of its national participation survey. Results of Michigan surveys from the 2000-01 school year to present may be viewed on the MHSAA Website – www.mhsaa.com – by clicking on Schools > Administrators > Sports Participation Listing.
The following chart shows participation figures for the 2014-15 school year from MHSAA member schools for sports in which the Association sponsors a postseason tournament:
BOYS GIRLS
SPORT |
SCHOOLS (A) |
PARTICIPANTS |
SCHOOLS (A) |
PARTICIPANTS (B) |
|
Baseball |
639/650/6 |
18,325 |
- |
-/8 |
|
Basketball |
726/733/5 |
21,401 |
665/726 |
15,702/14 |
|
Bowling |
355/371/9 |
3,711 |
339/366 |
2,970/13 |
|
Competitive Cheer |
- |
- |
335/348 |
7,189 |
|
Cross Country |
605/639/0 |
8,786 |
587/637 |
8,350/0 |
|
Football – 11 player |
597/621/59 |
39,338 |
- |
-/65 |
|
8-player |
33/38/0 |
685 |
- |
- |
|
Golf |
503/532/46 |
6,460 |
325/331 |
3,334/73 |
|
Gymnastics |
- |
- |
66/75 |
618 |
|
Ice Hockey |
232/269/11 |
3,448 |
- |
-/15 |
|
Lacrosse |
130/137/3 |
4,955 |
88/91 |
2,589/3 |
|
Skiing |
87/100/0 |
775 |
90/98 |
671/0 |
|
Soccer |
466/495/16 |
14,370 |
459/479 |
13,333/56 |
|
Softball |
- |
- |
570/635 |
13,113 |
|
Swimming & Diving |
233/264/3 |
4,935 |
256/275 |
5,617/3 |
|
Tennis |
299/316/6 |
6,294 |
335/345 |
8,628/11 |
|
Track & Field |
661/684/0 |
22,439 |
645/681 |
16,855/0 |
|
Volleyball |