


2018-19 Concussion Data Reinforces Trends
September 26, 2019
By Geoff Kimmerly
Second Half editor
Data on student-athlete concussions collected by the Michigan High School Athletic Association from member high schools during the 2018-19 school year further reinforced findings from the first three years of reporting, and will contribute significantly as a number of MHSAA-associated groups work during the coming year to reduce the incidence of those injuries.
The 2018-19 concussion report found student-athletes at MHSAA member high schools encountered a total of 3,686 head injuries during the past school year – 3.0 percent more than in 2017-18. But that slight increase barely affected two key ratios. The number of injuries per member school was 4.9, up just a tenth of a percent from 2017-18, and for the second straight year only 1.3 percent of participants in MHSAA sports experienced a head injury, still down from 1.4 in 2016-17 and 1.6 percent the first year of the study. Total participation in MHSAA sports for 2018-19 was 281,992 – with students counted once for each sport they played.
The MHSAA has continued to invite Michigan’s universities, health care systems and the National Federation of State High School Associations (NFHS) to take part in analyzing the data and resulting questions that have arisen during the past three years. The 2018-19 results will be examined by the MHSAA’s newly-formed Sports Medicine Advisory Committee and also undergo analysis by representatives of Michigan State University’s Institute for the Study of Youth Sports. Furthermore, the MHSAA is directing its sport committees to study the data as they consider adjustments that could be made to rules for practice and competition.
“The 2018-19 concussion survey further reinforced the findings and trends we have seen emerge; not only in specific sports, but across all of our activities – and this latest set of results also raises new questions,” MHSAA Executive Director Mark Uyl said. “We must continue to look at how changes to playing rules and improvements in equipment may be beneficial moving forward, and also how we can further educate administrators, coaches, athletes and parents to identify and provide treatment for these injuries as soon as possible. We also are excited for the opportunity to have more eyes on these results as we continue to explore more ways to make our games safer.”
As first mandated in 2015-16, member schools are required to report head injuries to the MHSAA identifying the sport that each student-athlete was participating in and whether the injury was sustained during practice or competition. Schools also are required to designate at which level – varsity, junior varsity or freshman – the injury occurred.
The full report of all head injuries experienced during 2018-19 by student-athletes at MHSAA member high schools – including percentages by sport (per 1,000 participants), gender and team level, as well as data tracking when athletes returned to play – is available on the Health & Safety page of the MHSAA Website.
Keeping with the first three years of this survey, the MHSAA continued to receive data from more than 99 percent of its member high schools after the fall, winter and spring seasons. Member junior high and middle schools also were allowed, although not mandated, to report their head injuries; and those findings are not part of the published report.
Boys in 2018-19 experienced 2,404 – or 65 percent – of concussion injuries, just a percent less than during 2017-18, and not surprisingly as boys have a much higher participation in contact sports. More than half of head injuries – 59 percent – were experienced by varsity athletes, a slight increase of three percent from the previous year. A total of 2,441 head injuries – or 66 percent – came in competition as opposed to practice. Just more than half took place during either the middle of practice or middle of competition as opposed to the start or end, and 51 percent of injuries were a result of person-to-person contact.
The MHSAA also asked schools to report the number of days between the head injury and the athlete’s return to activity – and the two largest groups returned to activity after either 6 to 10 days of rest (24 percent) or 11 to 15 days (23 percent). All of these findings were within 1-3 percent of those discovered from the 2017-18 data.
Contact sports again revealed the most head injuries. Ranking first was football, 11 and 8-player combined, with 44 head injuries per 1,000 participants – an increase of three per 1,000 from 2017-18 but the same ratio as 2016-17 and still down from 49 head injuries per 1,000 football participants shown by the first study in 2015-16. Ice hockey again revealed the second-most injuries per 1,000, with 35 (also up three from a year ago but still down from 36 injuries per 1,000 from 2016-17 and 38 per 1,000 in 2015-16), and girls soccer was third with 25 head injuries per 1,000 participants for the second year in a row. Wrestling followed with 22 head injuries per 1,000 participants.
Continuing a noticeable trend of the last few years, the next three sports to show the highest incidences of head injuries were girls sports – girls lacrosse, competitive cheer and basketball also revealed 20 per 1,000 participants, although basketball was down two injuries per 1,000 participants or nearly 10 percent from the previous year. Boys lacrosse (16), boys soccer (14), girls volleyball (11), softball (11) and gymnastics (10) also showed double-digit head injuries per 1,000 participants.
Females again reported significantly more concussions than males playing the same or similar sports – soccer, basketball and baseball/softball. Female soccer players reported nearly double the concussions per 1,000 participants as male soccer players (25 to 14), while female basketball players reported nearly triple the number of concussions per 1,000 participants (20 to 7). Softball players also reported nearly triple the concussions per 1,000 participants of baseball players (11 to 4).
Schools report possible concussions online via the MHSAA Website. Reports are then examined by members of the MHSAA staff, who follow up with school administrators as those student-athletes continue to receive care and eventually return to play. Student privacy is protected.
The reporting of concussions is part of a three-pronged advance by the MHSAA in concussion care begun during the 2015-16 school year. The MHSAA completed in spring 2017 the largest-ever state high school association sideline concussion testing pilot program, with a sample of schools from across the state over two years using one of two screening tests designed to detect concussions. The MHSAA also was the first state association to provide all participants at every member high school and junior high/middle school with insurance intended to pay accident medical expense benefits – covering deductibles and co-pays left unpaid by other policies – resulting from head injuries sustained during school practices or competitions and at no cost to either schools or families.
Previously, the MHSAA also was among the first state associations to adopt a return-to-play protocol that keeps an athlete out of activity until at least the next day after a suspected concussion, and allows that athlete to return to play only after he or she has been cleared unconditionally for activity by a doctor (M.D. or D.O.), physician’s assistant or nurse practitioner.
In addition, the MHSAA’s Coaches Advancement Program – which includes courses that must be completed by all varsity head coaches hired for the first time at a member school – provides substantial instruction on concussion care. Separately, rules meetings that are required viewing for high school varsity and subvarsity head and assistant coaches at the start of each season include detailed training on caring for athletes with possible head injuries.
2024 Scholar-Athlete Award Recipients Announced in Class A
By
Geoff Kimmerly
MHSAA.com senior editor
February 20, 2024
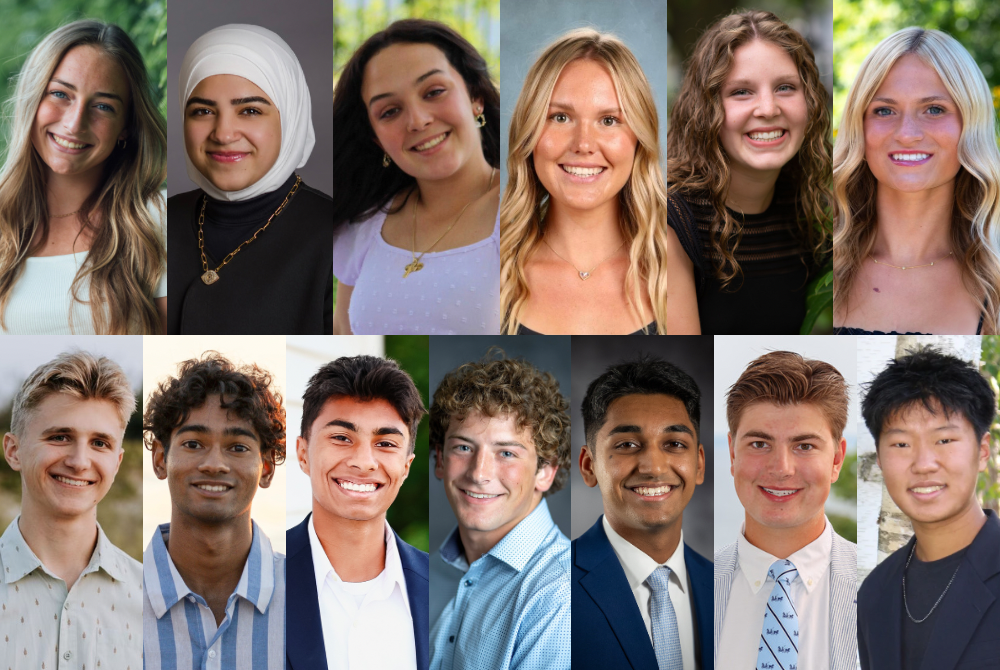
The Michigan High School Athletic Association has selected 13 student-athletes from Class A member schools to receive scholarships through the MHSAA/Farm Bureau Insurance Scholar-Athlete Award program.
 Farm Bureau Insurance, in its 35th year of sponsoring the award, will give $2,000 college scholarships to 32 individuals who represent their member schools in at least one sport in which the Association sponsors a postseason tournament. The first 30 scholarships are awarded proportionately by school classification and the number of student-athletes involved in those classes; also, there are two at-large honorees who can come from any classification.
Students applying for the Scholar-Athlete Award must be carrying at least a 3.5 (on a 4.0 scale) grade-point average and have previously won a letter in a varsity sport in which the Michigan High School Athletic Association sponsors a postseason tournament. Other requirements for the applicants were to show active participation in other school and community activities and produce an essay on the importance of sportsmanship in educational athletics.
The 32 scholarship recipients will be recognized March 16 during the MHSAA Boys Basketball Finals at the Breslin Student Events Center in East Lansing.
The Class A Scholar-Athlete Award honorees are Bella Adams, Battle Creek Lakeview; Aya Moughni, Dearborn; Arianna Pate, Gibraltar Carlson; Cecilia Ruchti, St. Joseph; Lily Sackrider, St. Johns; Katherine Slazinski, Birmingham Seaholm; Willem DeGood, Traverse City West; Abrar Hossen, Portage Central; Anirudh Krishnan, Plymouth; AJ Martel, Mason; Jaden Reji, Livonia Churchill; Charlie Seufert, East Grand Rapids; and Logan Yu, Midland Dow.
Overviews of the scholarship recipients of the Class A Scholar-Athlete Award follow. A quote from each recipient's essay also is included:
 Bella Adams, Battle Creek Lakeview
Played three seasons of varsity volleyball and is competing in fourth of track & field this spring. Helped volleyball team to two District championships and earned academic all-state in that sport three times. Earned all-league and all-region in track and also earned academic all-state three times in that sport. Served as captain of both teams. Participating in fourth year of student government and serving as class vice president. Participating in second year of National Honor Society and has attended Battle Creek Area Math & Science Center throughout high school. Participated in multiple initiatives to promote STEM education including Phoenix Gives Back as a junior, Kellanova’s high school program as a senior and the BCAMSC’s Kindness Club the last two years. Participated in church’s Battle Creek Mission Trip throughout high school. Serving on staff of school’s TV channel for first time as senior and coached elementary and middle school volleyball summer camps the last two years. Is undecided where she will attend college, but intends to study biology.
Essay Quote: “The single most important component of sportsmanship, and even in the world, is compassion. Being compassionate is not just how you treat your closest friends, but treating everybody as a friend. Compassion is what helps the lonely, hurt teenage girl feel secure, the timid new basketball player feel at home. All successful student-athletes carry the foundation of compassion through sportsmanship.”
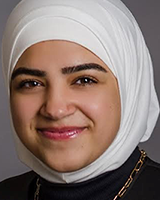 Aya Moughni, Dearborn
Ran three seasons of cross country and played two of varsity volleyball, will play her second of varsity soccer and compete in fourth of track & field this spring, and also played varsity basketball as a sophomore. Earned league multi-sport recognition and scholar-athlete honors multiple years. Served as captain for soccer, basketball and volleyball junior varsity teams and substitute captain for cross country and track & field varsities. Participating in second year of National Honor Society and third on Superintendent’s Student Advisory Council, and served as class vice president as sophomore. Founded Right to Play Club and serves as president, and also serves as president of Social Justice Club and treasurer of Gay-Straight Alliance. Served as Key Club vice president and director of outreach for Dearborn Youth Affairs Commission. Participating in first year of Business Professionals of America and as secretary, and qualified for state competition in multiple contests. Earned profile in courage award and multiple honors for voter registration. Is undecided where she will attend college but intends to pursue a career as a neurosurgeon.
Essay Quote: “In this vast arena of athletic education, sportsmanship stands as the unsung anthem for the underdog, the celebration of diversity, and the unyielding belief that fair play is the ultimate victory. It transforms the field into a space where young minds not only refine their physical abilities but also nurture the values that will shape them as future leaders, team players, and contributors to society.”
 Arianna Pate, Gibraltar Carlson
Ran four seasons of cross country, playing third season of varsity basketball and will compete in fourth season of track & field this spring. Earned all-league honors in cross country and track and all-area honorable mention in basketball, and helped basketball team to league championship as a sophomore. Serving as basketball team captain this season. Earned AP Scholar Award and honors from National African American Recognition Program and National Hispanic Recognition Program. Participating in second year of National Honor Society and as chapter president after serving as vice president as a junior. Serving fourth year on student council and as executive board secretary for second year after two years as class treasurer. Participating in fourth years of Earth Club and Inclusivity Club, second as part of Marauder Captains and third on Student Empowerment Team. Volunteered for three years as part of Red Cross blood drive. Will attend University of Michigan and study nursing.
Essay Quote: “It’s not just about helping someone up off of the ground, or saying “good game” in the handshake line after a competition. It’s about separating yourself from aggressive competition and instead showing empathy and care towards your fellow athletes whom you are lucky enough to share a playing field with. Especially in the realm of high school athletics, sportsmanship is one of the most important qualities that an athlete can have.”
 Cecilia Ruchti, St. Joseph
Ran four years of cross country and will play her fourth season of varsity tennis this spring. Earned all-state in tennis and reached No. 1 doubles semifinals at 2023 Lower Peninsula Division 2 Finals as team tied for sixth place. Earned all-league and all-region in cross country and helped that team to MHSAA Finals three times, also earning academic all-state in that sport. Served as captain of both teams multiple seasons. Participating in fourth year of student senate and as president, and also in fourth year as part of student foundation and as vice president. Serving as assistant teacher in third year of AP leadership course and also in third years as National Honor Society and writing center tutor. Served as tennis coach and camp instructor throughout high school and as athletic department intern as a senior. Is undecided where she will attend college, but intends to study marketing and design.
Essay Quote: “Walking away from Cross Country and Tennis State Finals, a lot of gratitude has washed over me. It’s been incredible to watch both my teammates and former teammates succeed. The time I shared with high-performing athletes and leaders influenced a lot of growth. I've observed extraordinary sportsmanship around me. I'm lucky to have coaches who have great integrity and preach hard work ethic. High school sports taught effective sportsmanship – on and off the course and court.”
 Lily Sackrider, St. Johns
Ran four seasons of cross country, is playing her third season of varsity basketball and will compete in her fourth season of track & field in the spring. Earned all-conference and academic all-state in cross country helping that team to one league and two Regional titles. Earned all-state as part of a track relay as a junior. Served as captain of all three teams. Carries 4.0 grade-point average. Participating in second year of National Honor Society and as chapter co-president, and has participated on Youth Action Committee throughout high school and Tri-County Youth Advisory Council the last two years and served as officer for both. Also has served on school’s athletic student leadership team three years. Played in school marching band throughout high school and as part of drum line the last three years, as section leader of the latter. Serves as voting member on St. Johns Area Community Fund Board. Participated three years with school’s Peer Assisted PALS and two with Compassion Club. Will attend Hope College or University of Michigan and study on a premedical track.
Essay Quote: “Therein lies the real value in educational athletics; the civic education it provides. The totality of sportsmanship prepares student athletes to be the absolute best people we can be when venturing into adult life. … Once we have mastered sportsmanship, we become capable of taking our acquired traits of compromise, accountability and kindness and weaving them into everyday life.”
 Katherine Slazinski, Birmingham Seaholm
Played two seasons of golf including on varsity this past fall, and will play fourth season of varsity tennis in the spring; also played two seasons of junior varsity volleyball. Earned all-state in tennis the last two seasons in helping team to 2023 Lower Peninsula Division 2 title and 2022 runner-up finish, winning No. 2 doubles flight as a junior. Served as tennis team captain. Earned AP Scholar with Distinction and National Merit Scholarship Commended Student recognition. Participating in third year of DECA, qualifying twice for state competition and serving as vice president of community service and social events the last two years. Participating in third year of National Honor Society and second of Spanish National Honor Society. Serving second year in multiple mentoring programs and second year as blood drive coordinator. Participated in YoungLife and as tennis coach and tournament assistant director throughout high school, and also is serving as marketing intern this year for Birmingham Education Foundation.
Essay Quote: “A major part of sportsmanship is putting the feelings of teammates or competitors before your own emotions. At times, this requires showing excitement for your teammates and all their hard work paying off, even when you are at your lowest points. At other times, this requires showing empathy to an opponent even when your first reaction is to celebrate your victory.”
 Willem DeGood, Traverse City West
Ran four seasons of cross country and will participate in fourth of track & field this spring; also competed on school’s Nordic/cross country skiing team all four years. Earned all-league and all-region in cross country and qualified for MHSAA Finals all four seasons. Competed at MHSAA Finals in track first three seasons and helped that team to three Regional titles. Earned academic all-state two years. Served as co-captain of both cross country and track teams. Earned AP Scholar with Distinction honor and participating in second years of National Honor Society and Spanish National Honor Society. Played in school’s concert and marching bands throughout high school and as part of philharmonic orchestra as a senior. Served as section leader and principal player, earned first-division solo recognition and selected to perform at Michigan Music Conference. Participating in second years of school’s global studies and arts community groups, and also serves as a math tutor and track club volunteer. Is undecided where he will attend college, but intends to major in international studies.
Essay Quote: “When competing, even for different teams, we are all stronger when we respect each other as good sportsmen and lift each other up. On the start line of every race, I always wish the runners next to me good luck because I know how much it means to know the people you’re facing on the track want the best for you, too.”
 Abrar Hossen, Portage Central
Ran three seasons of varsity cross country and will compete in his fourth of track & field this spring. Earned all-league honors in both sports, qualified for MHSAA Finals in both and served as captain of both teams as well. Earned AP Scholar with Distinction honor and named National Merit Scholarship Commended Student. Participating in second year of DECA and earned state championship, and served as chapter’s public relations director. Participating in third year on Kalamazoo Area Math & Science Center student senate, and participated in global battery solution research at Western Michigan University. Participating in second years of computer science club and Kids in Science club, as instructor for both to younger students in those topics, and has served as tutor throughout high school for students with learning disabilities. Founded school’s cultural dance group and serving as president of Health Occupations Students of America chapter. Is undecided where he will attend college but intends to study on a premedical track.
Essay Quote: “Although my time with my teammates is nearing its end, the fact that any of them can come to me for support will never change. The act of running sparks conversations, new connections, and brings communities together. These are acts of sportsmanship that often go unnoticed. A team cannot be expected to respect other teams when they are not yet close enough to respect each other.”
 Anirudh Krishnan, Plymouth
Ran four years of varsity cross country and will compete in fourth of track & field this spring. Also trained in taekwondo during first three years of high school and participated in Unified Sports basketball as a junior. Earned all-state honors in both cross country and track and academic all-state for both sports as well. Holds school race records in both sports and served as team leader for both. Earned third-degree black belt in taekwondo and taught that martial art. Founded and serves as director of AK Friendship Circle nonprofit organization supporting young adults with disabilities, and earned Ted Lindsay Foundation Family Courage Award for contributions toward autism education. Served two years on student council and participated in University of Michigan’s Youth Dialogues on Race and Ethnicity in Metropolitan Detroit. Will attend Johns Hopkins University and study applied mathematics and statistics.
Essay Quote: “In the journey to building good sportsmanship, coaches are key mentors. Sometimes in the heat of intense competition, winning seems to be the only thing that matters. However, having a coach who can provide a sense of balance and guide athletes to have a positive mindset and attitude is critical for educational athletics. In every sporting event, someone wins, and someone loses. Accepting victory with joy while not gloating over your opponents, and accepting defeat with grace while not being antagonistic to the winner reflects on the character of an athlete.”
 AJ Martel, Mason
Played four seasons of varsity football, wrestling for fourth season and competing in second of diving this winter, and will compete in third season of track & field this spring. Earned all-state in football multiple seasons and finished as school’s all-time leading rusher, and helped team to four league and three Regional titles and Division 3 runner-up finish this past fall. Helped wrestling team to Regional title this season for second time, earned all-league first three seasons and placed at Individual Finals as a freshman. Earned all-state in multiple events in track and won 300-meter hurdles at 2023 Lower Peninsula Division 2 Finals, helping team to runner-up finish. Earned all-league in diving and helped team to league title in 2023. Earned academic all-state in wrestling and football and academic all-league in track and diving. Participating in third year of National Honor Society and serving as senior class officer. Served as volunteer flag football coach and official and youth wrestling tournament worker. Participated in LINK program as a junior and serves as head of school’s athletics social media. Will attend Hope College and intends to study on a premedical track.
Essay Quote: “I realized that every person on the field was just a high school student who wanted the chance to play football. I didn’t have to detest (our rivals) because they attended a different school. I could appreciate the moment to compete against them while remembering that good sportsmanship benefits both teams.”
 Jaden Reji, Livonia Churchill
Played three seasons of varsity soccer and playing third season of varsity basketball. Earned all-conference multiple seasons in soccer and captained that team, and earned academic all-state in basketball. Named National Merit Scholarship semifinalist and AP Scholar with Distinction. Participating in third year of Spanish National Honor Society, as chapter president, and second year of Science National Honor Society, as vice president. Participating in third year of DECA, as chapter president, and was founding member of school’s chapter of Health Occupations Students of America and won a first place at HOSA International Leadership Conference. Participated in robotics throughout high school on team that twice qualified for world championships, and served as captain. Serving as Bible study leader for church youth group and as hospital volunteer and patient/family advisory council ambassador. Volunteered for school district’s summer Early Literacy Program. Participated in two years of debate and served as team secretary. Is undecided where he will attend college, but intends to study neuroscience on a premedical track.
Essay Quote: “Sportsmanship also requires humility and appreciation. I learned this from my experience in debate, where I present and clash with different opinions and perspectives. There is always something to learn from the other side, even if I disagree with them. I learned to acknowledge their strengths, address their arguments, and concede their points when warranted. I also learned to thank them for the opportunity to engage in a constructive dialogue and to improve my own skills.”
 Charlie Seufert, East Grand Rapids
Played three seasons of varsity tennis, will play third season of varsity golf this spring, and also played two seasons of subvarsity basketball. Earned all-state in doubles tennis, helping team to Regional championship and third-place Finals finish in the fall, and earned all-conference in golf as a junior. Served as captain of both teams. Participating in fourth year of Latin club, and as president, and serving third year on student council. A heart transplant recipient, serves as speaker and ambassador for American Heart Association. Participating in third year of school’s Leadership Youth Development group and as leader. Participated two years in We the People competition including on state championship team, and as coach, and two years on Model United Nations team. Volunteered and served as First Tee West Michigan lead coach, and participating in second year as elementary school mentor. Also serving as writer for school newspaper. Is undecided where he will attend college, but intends to pursue a career in public health.
Essay Quote: “Sportsmanship has always been important to be. As a golfer and tennis player, I have exhibited good sportsmanship on and off the course/court. However, it was not until I received my heart transplant did I truly understood the meaning of this word. … Persevering through these difficulties has forever changed the athlete that I am. I now understand that sportsmanship does not just mean treating opponents with respect, but also forming connections with others on and off the course.”
 Logan Yu, Midland Dow
Played four seasons of varsity tennis, earning all-state the last two and winning the Lower Peninsula Division 2 Finals title at No. 3 singles as senior in helping Dow win second-straight team championship. Earned academic all-state as senior and was part of four academic all-state teams. Served as team captain as senior. Participating in second year of National Honor Society and served as vice president. Participating in third year of DECA and twice qualified for state competition and last year for International Career Development Conference. Playing violin for second year as part of symphony & honors orchestra and qualified for the Michigan Music Conference as sophomore, and has played piano for more than 13 years qualifying for State Achievement Testing semifinals four times. Serving third year on Midland Youth Action Council and participating in second year of church youth group and as worship leader. Is undecided where he will attend college, but intends to study business analytics and information systems.
Essay Quote: “… As a freshman, I began looking up to one of the leading figures in my life, my coach, who displayed amazing acts of sportsmanship throughout our season. When we won, he celebrated privately with us. When we lost, he congratulated the other coach and pushed us to work harder. I began to see why he was such an effective coach and leader. … Now, I see every match as an opportunity to display sportsmanship, inspire others, and grow myself.”
Other Class A girls finalists for the Scholar-Athlete Award were Yan Yee Adler, Ann Arbor Pioneer; Sam M. Peot, East Grand Rapids; Julia Holt, Farmington Hills Mercy; Tori Briggs, Fowlerville; Cameron Herman, Hartland; Brooke Pedersen, Holland West Ottawa; Ella Chatfield, Jenison; Meghan Ford, Mason; Lauren VanSumeren, Midland Dow; Addison Raffle, Northville; Ella Boyd, Oxford; Abigail DeGraw, Rochester Hills Stoney Creek; Anna Lassan, South Lyon East; Addison Booher, Traverse City Central; Ava King, Traverse City West; London Williams, Trenton; Sarah Fromm, Utica; and Ryah Dewey, Walled Lake Western.
Other Class A boys finalists for the Scholar-Athlete Award were Viraj Nautiyal, Birmingham Seaholm; Dylan Shoresh, Birmingham Seaholm; Charles Howell, Cadillac; Erik Giedeman, Dearborn; Joseph Stachelek, Detroit U-D Jesuit; Charlie Lentz, East Grand Rapids; Chris Piwowarczyk, Fenton; TJ Silvernale, Grand Rapids Forest Hills Northern; Jack Ryan, Grosse Pointe South; Connor Curtis, Livonia Stevenson; Jonathan Song, Midland Dow; Jaxson Whitaker, Muskegon Reeths-Puffer; Kyle Brown, Northville; Sean Wilson, Oxford; Andrew Miller, Saline; Jack Carlisle, Stevensville Lakeshore; and Vansh Jvalit Baxi, Troy Athens.
The Class C and D scholarship award recipients were announced Feb. 6, and the Class B honorees were announced Feb. 13.
Farm Bureau Insurance of Michigan was founded in 1949 by Michigan farmers who wanted an insurance company that worked as hard as they did. Those values still guide the company today and are a big reason why it is known as Michigan’s Insurance Company, dedicated to protecting the farms, families, and businesses of this great state. Farm Bureau Insurance agents across Michigan provide a full range of insurance services — life, home, auto, farm, business, retirement, Lake Estate®, and more — protecting nearly 500,000 Michigan policyholders.
The MHSAA is a private, not-for-profit corporation of voluntary membership by more than 1,500 public and private senior high schools and junior high/middle schools which exists to develop common rules for athletic eligibility and competition. No government funds or tax dollars support the MHSAA, which was the first such association nationally to not accept membership dues or tournament entry fees from schools. Member schools which enforce these rules are permitted to participate in MHSAA tournaments, which attract more than 1.4 million spectators each year.