

Inside Selection Sunday: Mapnalysis '15
October 26, 2015
By Geoff Kimmerly
Second Half editor
Consider that one hour Sunday night was the product of nine weeks of games on top of two more weeks of practice, hours of lifting weights, conditioning and camps and a total of six months of work at the MHSAA office, in addition to hours upon hours put in by athletic directors scheduling years in advance.
The anticipation for the release of another year's MHSAA Football Playoff pairings is matched by a giant exhale only after the results are broadcast on Fox Sports Detroit, streamed online and posted on locker room doors and Facebook walls all over our state.
 And then the fun begins again.
But the Selection Sunday Show is the favorite hour of the season for many fans across our state. And that’s why, for the fifth year, we’ll explain our most difficult decisions in this Mapnalysis 2015 breakdown of how we paired 272 teams that will play next month for championships across nine divisions.
For those familiar with our playoff selection process, or who have read this report in the past and don’t want a refresher on how we do what we do, skip the next section and go directly to the “Observations & Answers: 2015.” For the rest, what follows is an explanation of how we selected the playoff pairings during the morning hours Sunday, followed by how we made some of the toughest decisions and a few thoughts on the breakdown of the field.
Ground Rules
Our past: The MHSAA 11-player playoff structure – with 256 teams in eight divisions, and six wins equaling an automatic berth (or five wins for teams playing eight or fewer games) – debuted in 1999. An 8-player tournament was added in 2011, resulting in nine champions total each season.
The first playoffs were conducted in 1975 with four champions. Four more football classes were added in 1990 for a total of eight champions each fall. Through 1998, only 128 teams made the postseason, based on their playoff point averages within regions (four for each class) that were drawn before the beginning of the season. The drawing of Districts and Regionals after the end of the regular season did not begin until the most recent playoff expansion.
In early years of the current process, lines were drawn by hand. Dots representing qualifying schools were pasted on maps, one map for each division, and those maps were then covered by plastic sheets. Districts and Regionals literally were drawn with dry-erase markers.
Our present: After a late Saturday night tracking scores, we file in as the sun rises Sunday morning for a final round of gathering results we may still need (which can include making a few early a.m. calls to athletic directors). Re-checking and triple-checking of enrollments, what schools played in co-ops and opted to play as a higher class start a week in advance, and more numbers are crunched Sunday morning as the fields are set.
This season, there were a record-low 216 automatic qualifiers by win total – with the final 40 at-large then selected, by playoff-point average, one from each class in order (A, B, C, D) until the field was filled. There were only four Class D additional qualifiers with 5-4 or 4-4 (playing eight games) records from which we could choose – so after those four we added 12 teams each from Class A, Class B and Class C.
Those 256 11-player teams are then split into eight equal divisions based on enrollment, and their locations are marked on digital maps that are projected on wall-size screens and then discussed by nearly half of the MHSAA staff plus a representative from the Michigan High School Football Coaches Association. Only the locations themselves are marked (by yellow dots) – not records, playoff point averages or names of the schools or towns. In fact, mentions of those are strictly prohibited. Records and playoff points are not part of the criteria. Matchups, rivalries, previous playoff pairings, etc. also DO NOT come into play.
The same process is followed for organizing the 8-player bracket, with the difference that the 16 teams are selected purely on playoff-point average.
Geography rules: This long has been rule number one for drawing MHSAA brackets in any sport. Travel distance and ease DO come into play. Jumping on a major highway clearly is easier than driving across county-wide back roads, and that’s taken into consideration. Also, remember there’s only one Mackinac Bridge and hence only one way to cross between peninsulas – and boats are not considered a possible form of transportation. When opponents from both peninsulas will be in the same District, distance to the bridge is far more important than as the bird flies.
Tradition doesn’t reign: Every group of 32 dots is a new group – these 32 teams have not been placed in a bracket together before. How maps have been drawn in the past isn’t considered – it’s hard to say a division has been drawn in a certain way traditionally when this set of 32 teams is making up a division for the first time.
Observations & Answers: 2015
Go north with ease: For the most part, most Regional pairings were easier to draw than in past years. For the most part. Divisions 2 and 4 were not easy, specifically when it came to deciding which teams would be paired with an Upper Peninsula qualifier or a team from the Traverse City area. Keep in mind, distance on these maps isn’t based on how the bird flies, but how a bus would drive. In Division 2, that meant putting Muskegon, Muskegon Mona Shores and Grand Rapids Forest Hills Northern – near U.S. 31 and U.S. 131 – with Traverse City Central instead of sending Midland and Midland Dow west, up I-75 and then east-to-west again on more non-highway roads. In Division 4, we considered pairing Alma and Saginaw Swan Valley with Escanaba instead of Big Rapids and Remus Chippewa Hills. That decision came down to Big Rapids being about 14 miles closer to Escanaba than Swan Valley (Whitehall would go with Big Rapids and Chippewa Hills regardless.).
Four counties wide: Yes, on first glance it looks a little odd that Bay City John Glenn and Orchard Lake St. Mary’s would be in the same Division 3 District – but look at the map as a whole. Eight Division 3 teams are located south and mostly east of St. Mary’s, and John Glenn is the only team that could be considered in the northeastern quarter of the Lower Peninsula (Mount Pleasant and Gaylord are right down the middle and naturals to go with Sault Ste. Marie and Petoskey.). With the thumb playoff qualifiers of near-similar size in Division 4, there were no other options than to create this four-county trip between the Eaglets and Bobcats.
Semifinal selection: When all the Regional lines are drawn for a division, we also must figure out which Regionals will meet for Semifinals. This annually provides some challenges. Do we match east vs. west or north vs. south? If something seems iffy in four weeks when those games are played, again, keep in mind the entire map and entire Regionals that are matched up.
Scheduled strong: Because we’re looking only at dots on a map, we don’t see the matchups until everything is drawn – and in that way, we’re like everyone else. It wasn’t lost on us that two 9-0 teams will have road games this week or three 5-4 at-large qualifiers will be at home. For those 9-0 teams, it’s true: there’s nothing more they could’ve done on the field. But here’s why they will travel.
- Clinton, in Division 6, hasn’t lost a regular-season game since 2011, and in fact plays in a strong Tri-County Conference made up of Class C schools and one Class D. Four of eight from the league made the playoffs, and the competition was so strong that Morenci and Petersburg-Summerfield will host games in Division 8. But Clinton’s opponent, Monroe St. Mary Catholic Central, while it did have one loss, fell to one-loss Class B Lansing Catholic – and the Falcons played eight Class B and one Class A school this season. Beating a Class B team is worth 16 points more than beating a Class C and 32 more than beating a Class D (with those points then divided over the number of games a team plays that season) – and all of that made the difference in St. Mary’s final eight-point playoff average edge over Clinton.
- Saugatuck in Division 7 is a similar story. The Indians are one of three undefeated teams in their District, and did play a pair of Class B opponents. But by no fault of their own, especially in league play where the schedule is set, Saugatuck didn’t face a team this season that won more than five games. Hesperia played three Class B opponents including one that finished 6-3 – enough for the slim 1.8 points more in playoff average that earned the Panthers homefield advantage. Pewamo-Westphalia has the highest average in the District and didn’t play a Class B – the Pirates actually played three Class D teams. But they also beat four teams that made the playoffs including two that finished 8-1 – giving them a 2.7-point edge on Hesperia and 4.5 edge on Saugatuck.
- The 5-4 teams that will host – Redford Thurston in Division 3 and Escanaba and Benton Harbor in Division 4, all earned their spots. Escanaba faced six playoff teams and beat three, Class B Benton Harbor played eight Class A teams, and Thurston played five playoff teams and a sixth that just missed an at-large bid.
At the end of the day ...
What you see is what our committee decided upon after multiple discussions among multiple groups that broke down every sensible possibility we could muster. There are certainly points open to argument – and we likely made those arguments as well.
Those who would like to see the playoff selection process changed are in favor of a larger strength-of-schedule component, and it’s interesting to see how strength of schedule inadvertently made a larger impact this season than in the recent past – especially given the examples above of undefeated teams going on the road and at-large teams hosting.
Why were there fewer automatic qualifiers than ever before? Here's one theory. There were 11 fewer teams in 11-player football this season than in 2014 (most moved to 8-player). An argument can be made that there were fewer wins to be gained against teams that last season might have struggled to field 11-player teams, shifting the balance to fewer automatic qualifiers and more parity with stronger teams facing each other to fill their schedules.
Meanwhile, the 8-player field grew by nine teams this fall and has its strongest ever, with seven teams that finished 5-4 missing the postseason after a team with a sub-.500 record got in just a year ago.
Given how some matchups shook out this fall, the next argument by those seeking change likely will center on seeding entire Regionals instead of just Districts. But keep this in mind as well: if Regionals were seeded with this year's groupings, it would create possibilities of first-week trips like Battle Creek to Traverse City and Cedar Springs to Sault Ste. Marie. We're fairly sure most coaches and players would dread such journeys for a first-round game.
It's a lot to digest, and the scrutinizing will surely continue long after these playoffs are done as we all work to conduct the best tournament possible.
But at the end of the day – and the end of these next five weeks – to be the best, teams will need to beat the best no matter the matchups. And we’ve got plenty to look forward to starting this weekend and all the way through the 11-player Division 3 Final on Nov. 28 at Ford Field.
The MHSAA Football Playoffs are sponsored by the Michigan National Guard.
PHOTO: The Division 4 map was among the most difficult to draw during this year's selection process.
1st & Goal: 2021 11-Player Semifinals Review
By
Geoff Kimmerly
MHSAA.com senior editor
November 22, 2021
The 11-Player Football Finals field is set. Ford Field, here we come.
 After crisscrossing the Lower Peninsula on Saturday for Semifinals, all vehicles will be pointed toward downtown Detroit this weekend – including parades from a few communities we’ll be seeing for the first time.
Belleville, Warren Michigan Collegiate and Lawton, welcome to a Thanksgiving week like no other. The other 13 teams that will be making the trip Friday and Saturday have been to this point before – including three just 10 months ago – and surely they’d agree this trip to Detroit will be unforgettable.
Below is a glance at how all 16 took the final step to earn the opportunity.
(We’ll review Saturday’s 8-Player Finals – won by Adrian Lenawee Christian and Powers North Central – during a look back at all 10 football championship games next week.)
Division 1
Belleville 40, Sterling Heights Stevenson 26
In their fourth-straight Semifinal, the Tigers (12-1) earned their first Finals trip. Freshman quarterback Bryce Underwood threw three touchdown passes and ran for one more as Belleville scored the most points Stevenson (10-3) had allowed in a game since a Week 1 loss to Rockford. Click for more from the Detroit Free Press.
Belleville freshman quarterback Bryce Underwood (@BryceUnderwoo16) with three touchdown passes in the win over Sterling Hts. Stevenson in the Division 1 Football Semifinal.
TD Receptions:@deshaun3lee
Jalen Johnson@trev_joness@JermainCrowell
#StateChamps X @hungryhowies pic.twitter.com/qgjKwAp8Ao— STATE CHAMPS! Michigan (@statechampsmich) November 21, 2021
Rochester Adams 40, Grand Blanc 20
Adams (13-0) won a matchup of undefeated teams to reach the Finals for the first time since 2003, showing its defensive might again in shutting down a Bobcats offense that averaged 42 points per game entering the day. Grand Blanc finished its longest tournament run and winningest season at 12-1. Click for more from the Oakland Press.
Rochester Adams (@R_AdamsFootball) Junior LB Tait Picot (@PicotTait) with the pick six in the 40-20 semifinal win over Grand Blanc.#StateChamps X @LTUAthletics pic.twitter.com/uM809Q72RC
— STATE CHAMPS! Michigan (@statechampsmich) November 21, 2021
Division 2
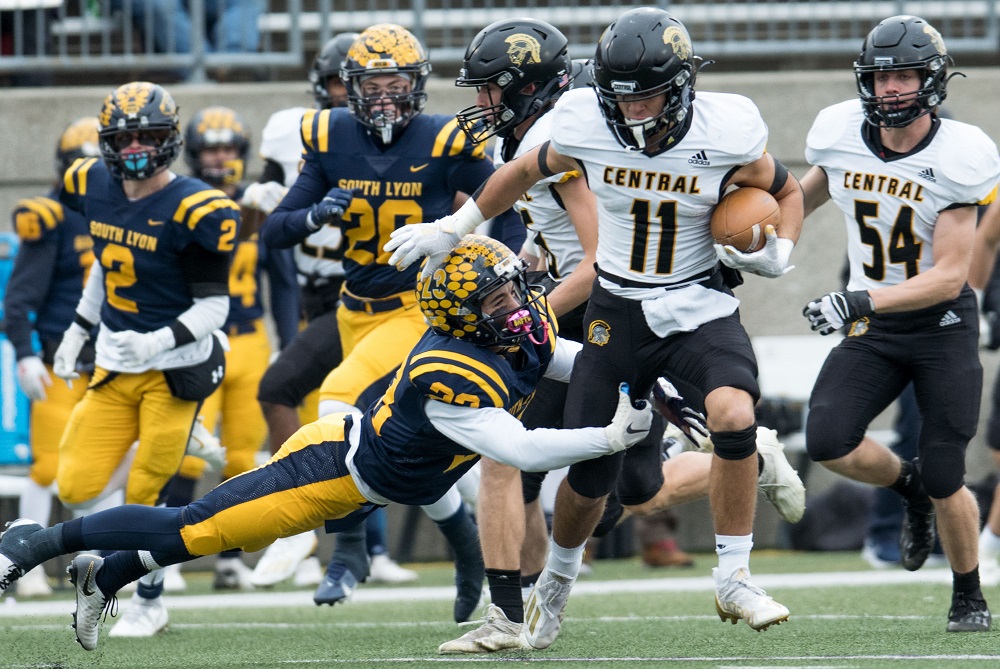
Traverse City Central 56, South Lyon 20
The Trojans (12-1) earned their first Finals trip since 1988. Central took a 42-7 lead into halftime as Josh Burnham scored three touchdowns, and blocked a field goal attempt too. South Lyon (12-1) was making its first Semifinal appearance since 2004. Click for more from the Traverse City Record-Eagle.
Here's the first half highlights of the Traverse City Central vs. South Lyon | Division 2 Football Semifinal. @JoshuaBurnham20 @carson_bourdo
🎥WBPN-TV#StateChamps X @MHSAA pic.twitter.com/mZv7GwuY2y
— STATE CHAMPS! Michigan (@statechampsmich) November 21, 2021
Warren De La Salle Collegiate 49, Livonia Franklin 14
The Pilots (12-0) will play in their fourth Division 2 Final in five seasons, with an opportunity to finish undefeated for the first time during the playoff era. Junior quarterback Brady Drogosh threw for two touchdowns and ran for two more, including a 73-yarder. Franklin finished 7-6 after entering the playoffs 4-5. Click for more from the Macomb Daily.
De La Salle QB Brady Drogosh ran for 2 touchdowns of 55 and 73 yards in the 49-14 win over Livonia Franklin this afternoon. @DLSPilots @DLSFootball_MI @BDrogosh #StateChamps x @DMC_Rehab pic.twitter.com/We2HYxCR8V
— STATE CHAMPS! Michigan (@statechampsmich) November 20, 2021
Division 3
Detroit Martin Luther King 46, Mason 7
The Crusaders (12-1) advanced to their fourth Final in six seasons and first since 2019. While topping 40 points for the seventh time in 11 games played on the field, King also lowered its playoff points-allowed average to 9.5 with a second-straight game giving up a single score. Mason completed its winningest season, and longest playoff run, at 10-3. Click for more from the Detroit Free Press.
Our Mr. Football candidate Dante Moore (@dantemoore05) with another touchdown pass in the 1st quarter, this one to Joseph Williams (@elite_joe1) as Detroit King (@DetKingFootball) went onto beat Mason in the Division 3 Semifinal. #StateChamps X @hungryhowies pic.twitter.com/tQ7heMFVty
— STATE CHAMPS! Michigan (@statechampsmich) November 20, 2021
DeWitt 43, St. Joseph 7
The Panthers (12-1) will return to Ford Field with an opportunity to repeat as Division 3 champions. DeWitt built a 29-0 halftime lead, as quarterback Ty Holtz threw three first-half touchdown passes, including 69 and 40-yarders to Tommy McIntosh. St. Joseph (8-5) was playing in its first Semifinal since 2007 after entering the postseason 5-4. Click for more from the Lansing State Journal.
Our Mr. Football candidate Ty Holtz (@tyholtz_) from DeWitt (@dewittathletics) connected with the @BadgerFootball commit Tommy McIntosh for two touchdowns in the win over St. Joseph on Saturday.
🎥https://t.co/duQnD6Kq0j#StateChamps X @MHSAA pic.twitter.com/mJfhLTbGoV
— STATE CHAMPS! Michigan (@statechampsmich) November 21, 2021
Division 4
Chelsea 30, Freeland 27
For the second straight week, Chelsea came up with a big play at the end to advance. This time it was a near-goal line stand to stop a Freeland offense that had gotten two rushing and two passing touchdowns from quarterback Bryson Huckaby. The Falcons finished a second-straight Semifinal run 11-2. Click for more from the Ann Arbor News.
Freeland 4th and 3 on the four yard line with 48 seconds left and the Chelsea defense comes through with the stop. They measure for the first down and it’s just short. @ChelseaFB_SEC @ChelseaBulldogs #StateChamps X @MHSAA pic.twitter.com/n9FaLNOUwc
— STATE CHAMPS! Michigan (@statechampsmich) November 20, 2021
Hudsonville Unity Christian 58, Edwardsburg 8
The Crusaders (13-0) moved into second all-time for scoring in one season at 751 points with their 11th game putting up more than 50, and with a defensive showing to match – Edwardsburg (12-1) entered the game averaging 53 points per. Unity’s Abraham Rappuhn scored three first-half touchdowns, including an 81-yarder. Click for more from FOX 17.
Jason Hutton (@jhutt5) brings you the highlights of the Unity Christian (@UCSaders) vs. Edwardsburg | Division 4 Football Semifinal from this afternoon.
🎥WXMI-TV#StateChamps X @hungryhowies pic.twitter.com/Gn6lwANE1M
— STATE CHAMPS! Michigan (@statechampsmich) November 21, 2021
Division 5
Grand Rapids Catholic Central 35, Frankenmuth 0
The rematch of last season’s Division 5 championship game saw Grand Rapids Catholic Central (13-0) go up 21-0 midway through the first quarter. Cougars quarterback John Passinault ran for three touchdowns and threw for the other two. Frankenmuth finished 12-1, its only losses the last two seasons to GRCC. Click for more from the Grand Rapids Press.
Jason Hutton (@jhutt5) brings you the highlights of the Grand Rapids Catholic Central (@GRCC_CougarsFB) vs. Frankenmuth | Division 5 Football Semifinal from this afternoon.
🎥WXMI-TV#StateChamps X @LTUAthletics pic.twitter.com/bbgNJTr4jY
— STATE CHAMPS! Michigan (@statechampsmich) November 21, 2021
Marine City 27, Portland 7
The Mariners (13-0) are headed back to Ford Field for the first time since 2013 after another dominating defensive performance – they haven’t given up more than 14 points in a game, and lowered their per game defensive average to 9.1 allowed per contest. The Raiders finished 10-3. Click for more from the Port Huron Times-Herald.
Marine City Junior QB Jeff Heaslip connects with Sophomore Parker Atkinson on the 38-yard score to put the Mariners up 7-0 over Portland!@marine_high @MCGoBlack @mariner_mc @jeffery_heaslip #StateChamps X @MIArmyGuard pic.twitter.com/La2ivg7nzF
— STATE CHAMPS! Michigan (@statechampsmich) November 20, 2021
Division 6
Lansing Catholic 18, Standish-Sterling 7
The Cougars will be returning to Ford Field seeking a second championship in three seasons to go with a 2019 title in Division 5. The Cougars (12-1) matched defense with defense, scoring their second-fewest points this fall but holding Standish-Sterling to a tie for the latter’s lowest output. The Panthers finished 10-3, making an incredible jump from last season’s 1-6 record. Click for more from the Lansing State Journal.
Lansing Catholic (@lansingcatholic) junior Nic Gruber with two touchdown runs as the Cougars went onto beat Standish-Sterling in the Division 6 Football Semifinal on Saturday afternoon. @lchscougarsport
🎥WILX-TV#StateChamps X @MHSAA pic.twitter.com/T7wd5QKzNK
— STATE CHAMPS! Michigan (@statechampsmich) November 21, 2021
Warren Michigan Collegiate 36, Michigan Center 29
Michigan Collegiate (11-2) earned its first trip to the Finals, thanks in part to a series of big plays by Deion Black on both sides of the ball. The teams were tied after three quarters, and traded scores in the fourth with the Cougars reaching the end zone last. Michigan Center finished 11-2, setting a program record for wins. Click for more from MLive-Detroit.
Deion Black (@de1on_) was getting it down on both sides of the ball for @MCisFamily.#StateChamps x @DMC_Rehab pic.twitter.com/igt03bLpJE
— STATE CHAMPS! Michigan (@statechampsmich) November 21, 2021
Division 7
Lawton 21, Jackson Lumen Christi 20
The Blue Devils are headed to the Finals for the first time after following up a memorable Regional Final win with perhaps an even more unforgettable Semifinal finish. Landon Motter’s two-point conversion with 46 seconds to play put Lawton (13-0) up for good. The Blue Devils had jumped out to a 13-0 first-half lead but found themselves trailing Lumen Christi (11-2) by a point heading into the fourth quarter. Click for more from the Kalamazoo Gazette.
Jason Hutton (@jhutt5) brings you the highlights of the Lawton vs. Lumen Christi | Division 7 Football Semifinal from this afternoon.
🎥WXMI-TV#StateChamps X @MIArmyGuard pic.twitter.com/iOGNcOoa6b
— STATE CHAMPS! Michigan (@statechampsmich) November 21, 2021
Pewamo-Westphalia 28, Traverse City St. Francis 21
The Pirates (13-0) will have a chance to win a second Division 7 title in three years after holding off last season’s runner-up St. Francis (12-1). The teams were tied 14-14 heading into the final quarter, and P-W’s defense was able to slow St. Francis’ offense for most of it, for the game holding the Gladiators to their fewest points this season and well below their average of 50 per game. Click for more from the Lansing State Journal.
Jason Hutton (@jhutt5) brings you the highlights of the Pewamo-Westphalia (@PWGRIDIRON) vs. Traverse City St. Francis | Division 7 Football Semifinal from this afternoon.
🎥WXMI-TV#StateChamps X @hungryhowies pic.twitter.com/lzElUyi71e
— STATE CHAMPS! Michigan (@statechampsmich) November 21, 2021
Division 8
Beal City 12, Ubly 7
The Aggies (12-1) will return to the Finals for the second time in three seasons thanks to the latest of a string of strong defensive showings. Beal City lowered its points-allowed average to 8.3 per game by stopping an Ubly offense that had averaged 45 per game entering Saturday. The Bearcats (12-1) were last season’s Division 8 runners-up up. Click for more from the Mount Pleasant Morning Sun.
Beal City got on the board 1st. Senior Cade Block refuses to go down, plowing through defenders and diving into the end zone to give the Aggies a 6-0 lead over Ubly. @BealCityAggieFB @bcaggieathletic @BlockheadCade#StateChamps x @LTUAthletics pic.twitter.com/AaXuabW00N
— STATE CHAMPS! Michigan (@statechampsmich) November 20, 2021
Hudson 28, Ottawa Lake Whiteford 22
The Tigers (13-0) advanced to their first championship game since 2010 relying again on an excellent defense to slow down a Whiteford offense averaging 51 points per game, but also on the legs of Bronson Marry – who ran for four second-half touchdowns as Hudson came all the way back from a 22-0 halftime deficit. It was the only loss to an in-state opponent this fall for the Bobcats (11-2). Click for more from the Adrian Daily Telegram.
Bronson Marry had four rushing touchdowns in the 2nd half as Hudson (@hudson_schools) went onto beat Ottawa Lake Whiteford in the Division 8 Football Semifinal. #StateChamps X @MHSAA pic.twitter.com/FqM5w3CKVv
— STATE CHAMPS! Michigan (@statechampsmich) November 21, 2021
Second Half’s weekly “1st & Goal” previews and reviews are powered by MI Student Aid, a part of the Office of Postsecondary Financial Planning located within the Michigan Department of Treasury. MI Student Aid encourages students to pursue postsecondary education by providing access to student financial resources and information. MI Student Aid administers the state’s 529 college savings programs (MET/MESP), as well as scholarship and grant programs that help make college Accessible, Affordable and Attainable for you. Connect with MI Student Aid at www.michigan.gov/mistudentaid and find more information on Facebook and Twitter @mistudentaid.
PHOTO Traverse City Central's Carson Bourdo (11) tries to break away from a South Lyon defender during Saturday's Division 2 Semifinal win. (Photo by Jamie McNinch.)